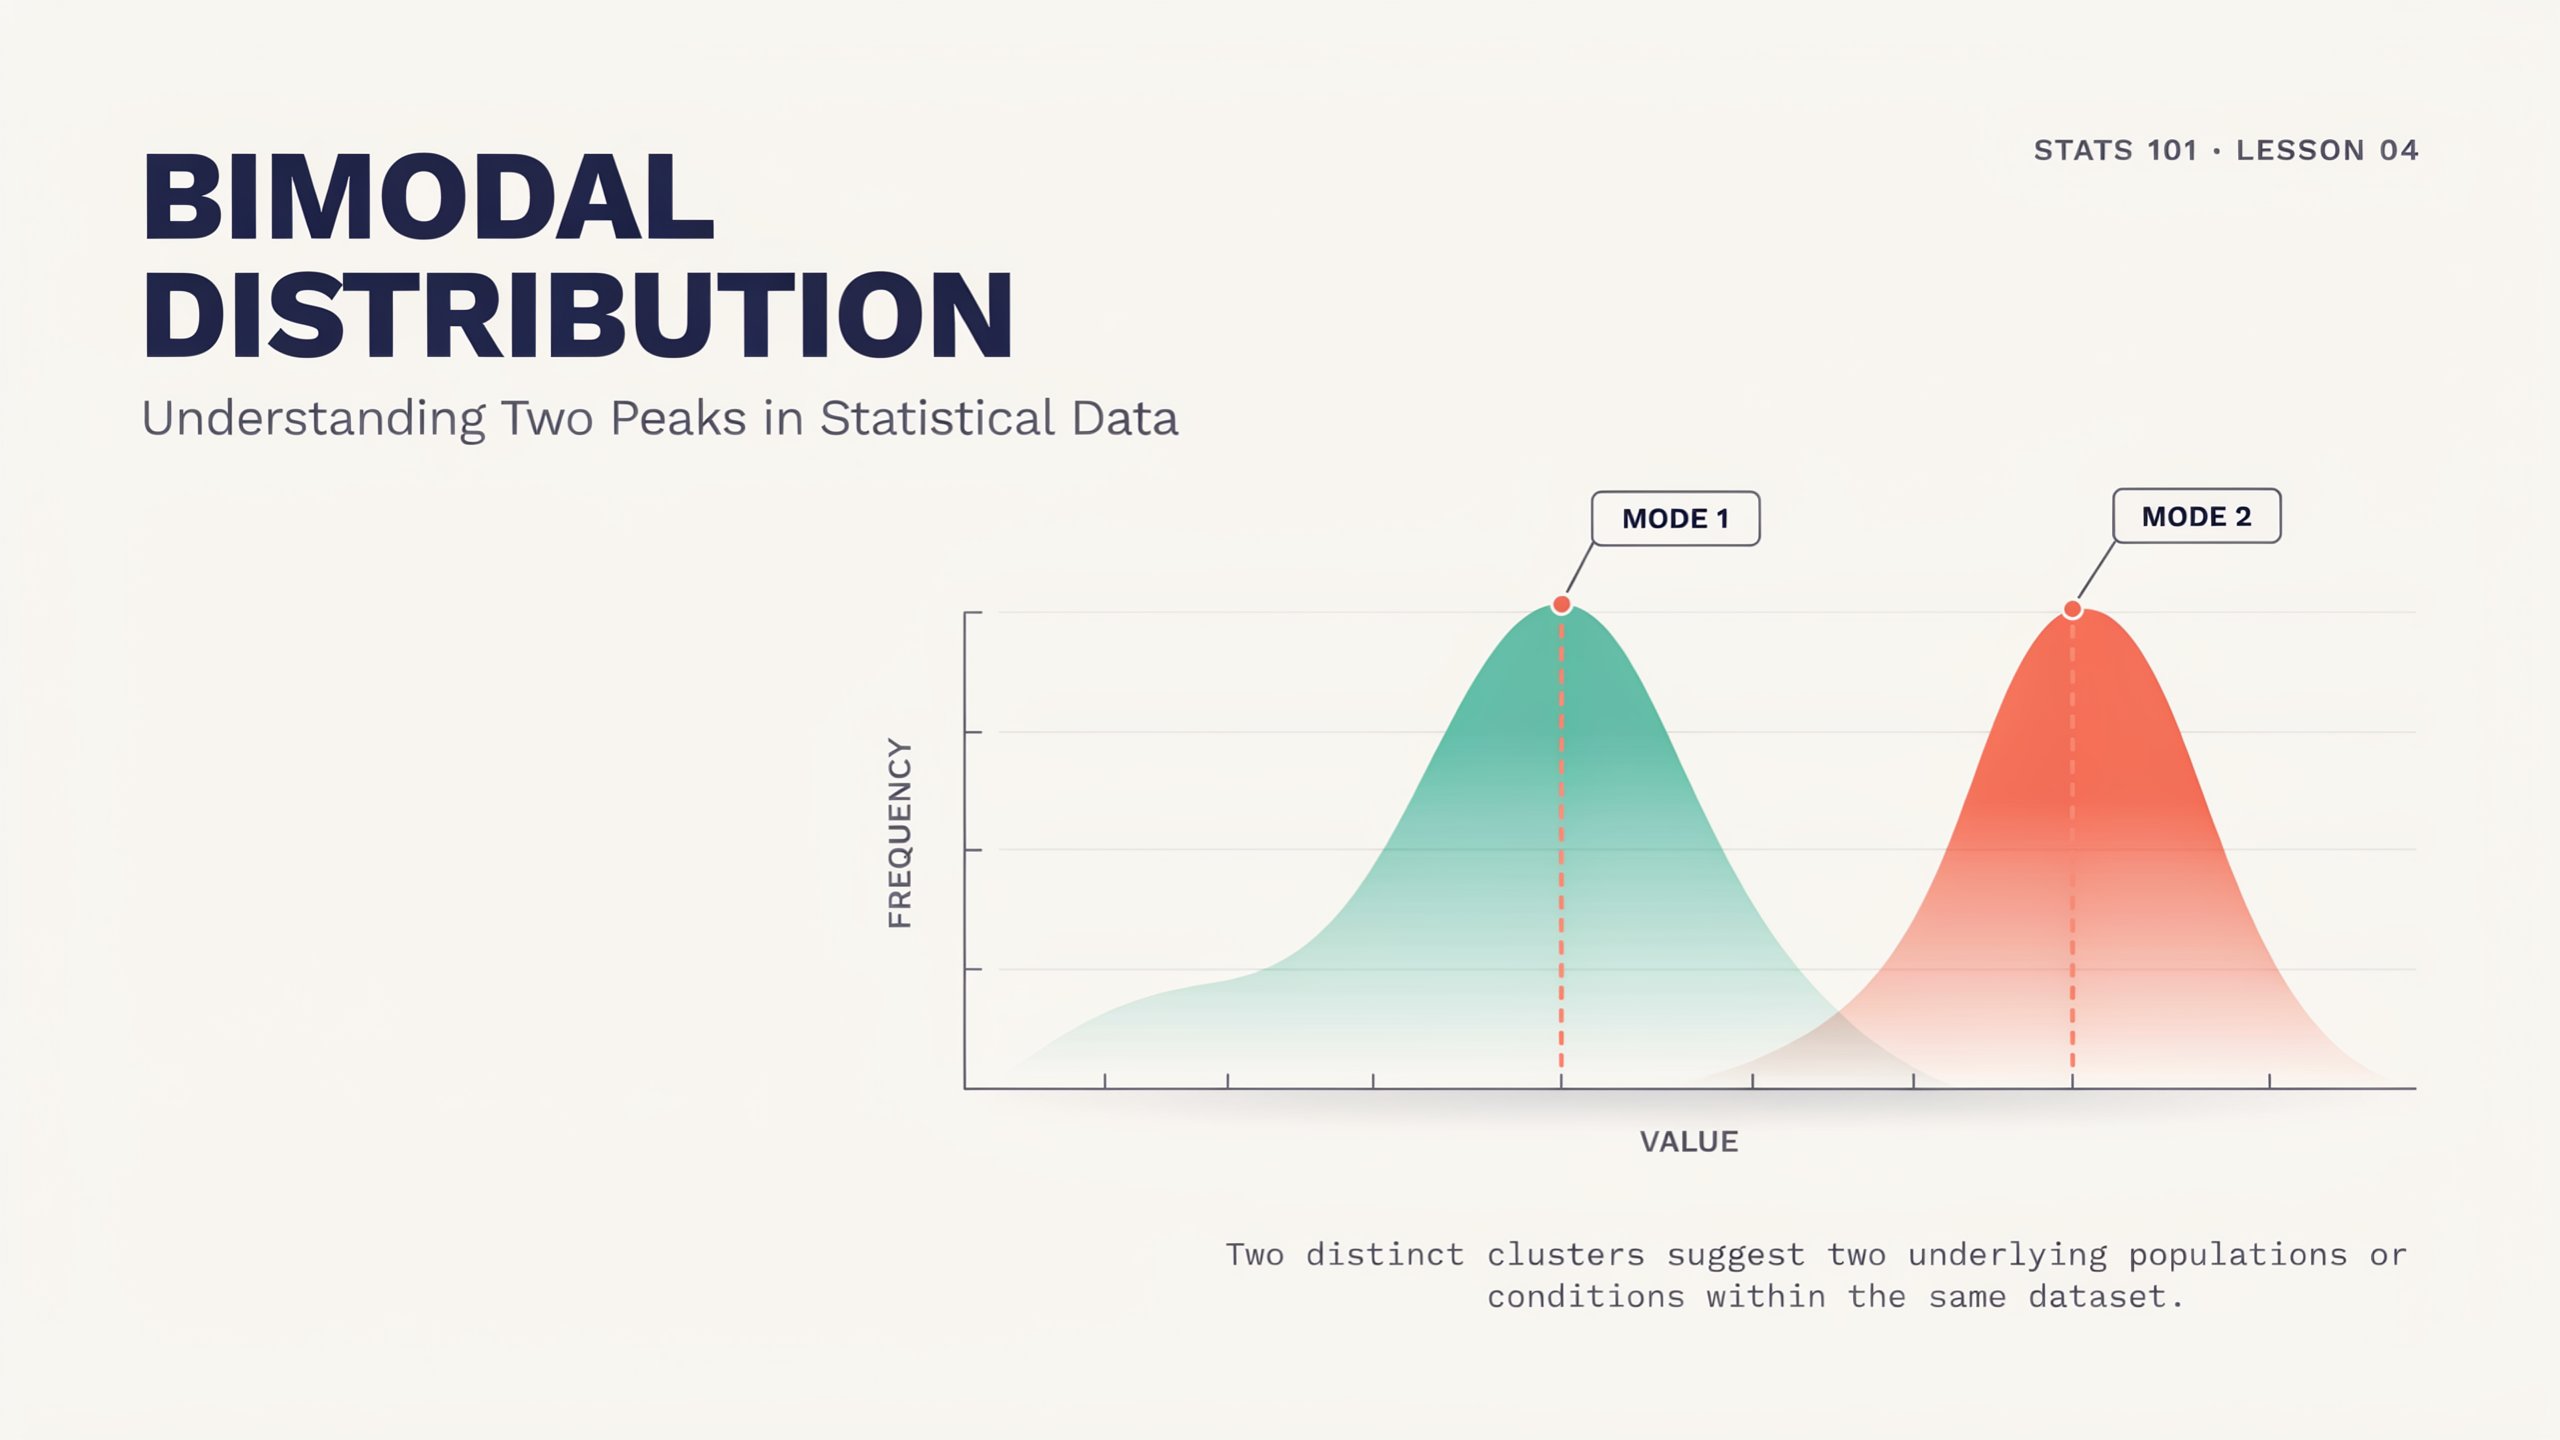
Bimodal Distribution: Understanding Two Peaks in Statistical Data
When we collect and analyze data, the shape of its distribution can reveal important information about the population being studied. Most people are familiar with distributions that have one clear peak, but some datasets contain two distinct peaks. Such a distribution is called a bimodal distribution.
The word bimodal comes from two parts: “bi”, meaning two, and “modal”, relating to the mode. In statistics, a bimodal distribution is a distribution with two prominent modes or peaks. These peaks represent values or ranges of values that occur with relatively high frequency.
Bimodal distributions are especially interesting because the two peaks may indicate that the dataset contains two different underlying groups or populations. Recognizing this pattern can help researchers understand their data more accurately and avoid misleading conclusions.
1. What Is a Bimodal Distribution?
A bimodal distribution is a probability distribution or dataset that has two distinct peaks in its frequency distribution.
A peak represents a value or range where observations are concentrated. In a bimodal distribution, there are two such areas of concentration.
For example, imagine collecting the heights of 1,000 people. If the sample contains both children and adults, the resulting histogram might show one peak around the typical height of children and another around the typical height of adults.
This creates a distribution with two modes.
Simple example
Consider the following simplified dataset:
10, 11, 10, 12, 11, 20, 21, 20, 22, 21
There are two clusters:
- One around 10–12
- Another around 20–22
If these values were represented in a histogram, the graph would show two peaks.
2. Why Does a Bimodal Distribution Occur?
A bimodal distribution often occurs because two different groups are combined into a single dataset.
For example, suppose a researcher records the test scores of students from two different classes. If one class performs around 50–60 and the other performs around 75–85, combining both groups could produce two peaks.
Common causes include:
- Two different populations being mixed together
- Different demographic groups
- Different experimental conditions
- Seasonal or environmental effects
- Different behavioral patterns
- Multiple sources contributing to the same dataset
Therefore, a bimodal pattern can sometimes provide a clue that the data should be examined more closely.
3. How Does a Bimodal Distribution Look?
The easiest way to recognize a bimodal distribution is usually through a histogram or density plot.
A typical unimodal distribution has one major peak:
▁▂▃▅▇▅▃▂▁
A bimodal distribution has two major peaks:
▁▂▅▇▅▂▁▂▅▇▅▂▁
The valley between the peaks represents an area where relatively fewer observations occur.
Importantly, the two peaks do not have to be exactly the same height. One peak may be much larger than the other.
4. Bimodal Does Not Simply Mean “Two Equal Modes”
A common misconception is that a bimodal distribution must have two peaks of exactly equal size.
That is not true.
A distribution can be considered bimodal when it has two distinct and meaningful modes, even if one peak contains considerably more observations than the other.
For example:
- First peak: 70 observations
- Second peak: 30 observations
This can still represent a bimodal pattern if the two groups are sufficiently separated.
The important feature is the presence of two distinct concentrations, not identical frequencies.
5. Bimodal vs. Unimodal Distribution
Understanding bimodal distributions becomes easier when we compare them with unimodal distributions.
Unimodal distribution
A unimodal distribution has one primary peak.
Example:
▁▂▃▅▇▆▄▂▁
A common example is a roughly normal distribution, although not every unimodal distribution is normal.
Bimodal distribution
A bimodal distribution has two primary peaks.
Example:
▁▂▅▇▅▂▁▂▄▇▅▂▁
The distinction is important because a single average may summarize a unimodal dataset reasonably well, while a bimodal dataset may contain important subgroups that the average hides.
6. Bimodal vs. Multimodal Distribution
A distribution with more than one mode is generally described as multimodal.
The terms can be distinguished as follows:
| Distribution | Number of prominent modes |
| Unimodal | 1 |
| Bimodal | 2 |
| Trimodal | 3 |
| Multimodal | Multiple |
Thus, a bimodal distribution is a specific type of multimodal distribution with two prominent modes.
7. Real-World Example: Human Heights
Human height is a useful example for understanding the idea of multiple groups.
If researchers combine the heights of two populations with substantially different typical heights, the resulting data may show two concentrations.
For example, a dataset containing two distinct age groups could produce:
- A lower peak representing the shorter group
- A higher peak representing the taller group
The two peaks could therefore provide evidence that the overall sample contains different subgroups.
However, the appearance of two peaks alone does not prove that exactly two populations caused them. Researchers need additional information about how the data were collected.
8. Real-World Example: Exam Scores
Imagine a teacher combines the examination scores of two groups of students.
Suppose:
- Group A generally scores between 40 and 55
- Group B generally scores between 70 and 85
A histogram of all students may show two peaks.
This could suggest that the groups have different characteristics, such as:
- Different levels of preparation
- Different instructional methods
- Different versions of an examination
- Different backgrounds or learning experiences
The bimodal shape encourages the researcher to investigate why the groups differ.
9. Real-World Example: Customer Behavior
Businesses can also encounter bimodal distributions.
Suppose a company studies how much customers spend per purchase. It might discover two major groups:
- Customers who make relatively small purchases
- Customers who make much larger purchases
A histogram of spending could therefore have two peaks.
This information could help the company identify different customer segments and develop strategies appropriate for each group.
10. Why the Mean Can Be Misleading
One of the most important reasons to recognize bimodal distributions is that a single average can hide the structure of the data.
Imagine a dataset with two clusters:
- Group A: around 20
- Group B: around 80
The mean could be around 50.
But perhaps very few observations actually occur near 50.
Therefore, saying that the “typical” observation is 50 could be misleading.
The data may actually consist of two groups centered around 20 and 80.
This is why researchers should examine the distribution itself, rather than relying only on summary statistics.
11. How to Identify a Bimodal Distribution
Several approaches can help identify bimodality.
1. Use a histogram
A histogram is one of the simplest ways to visually inspect the distribution.
Look for:
- Two prominent peaks
- A noticeable valley between them
- Two areas where observations are concentrated
2. Use a density plot
A density plot provides a smoothed representation of the distribution and can make multiple peaks easier to see.
3. Examine the raw data
Looking at the observations themselves can reveal clusters that may not be obvious from summary statistics.
4. Investigate possible subgroups
Ask whether the observations can logically be divided into groups based on variables such as age, location, gender, treatment, or other relevant characteristics.
12. The Importance of Bin Width
When using a histogram, the choice of bin width can strongly affect the appearance of the distribution.
A very large bin width may hide two peaks and make the distribution appear unimodal.
A very small bin width may create many small fluctuations that look like additional peaks.
Therefore, researchers should not conclude that a dataset is bimodal based on one histogram setting alone.
It is useful to examine the distribution using reasonable alternative bin widths and, when appropriate, other visualization methods.
13. Bimodality Does Not Always Mean Two Populations
Although bimodality can indicate that two groups have been combined, this is not the only possible explanation.
Two peaks can arise from:
- Natural variation
- Measurement processes
- Periodic patterns
- Different environmental conditions
- Sampling effects
- A mixture of populations
Therefore, researchers should avoid immediately concluding:
“Two peaks mean there are exactly two populations.”
Instead, bimodality should be treated as a signal for further investigation.
14. The Role of the Mode
The mode is the value or category that occurs most frequently in a dataset.
In a simple discrete dataset, identifying the mode can be straightforward.
However, for continuous data, researchers often work with ranges and density estimates, so the concept of a “peak” is more useful than simply finding one repeated numerical value.
A bimodal distribution therefore has two prominent areas of high frequency or density.
15. Bimodal Distributions in Research
Bimodality can be particularly valuable in scientific and social research.
Researchers may use it to investigate whether:
- A population contains distinct subgroups
- Two different processes are producing the observations
- An intervention affects groups differently
- Data from different sources have been combined
- Additional explanatory variables are needed
For example, if a researcher expects one population to behave similarly but discovers two strong clusters, that finding may lead to a more detailed investigation.
16. Advantages of Recognizing Bimodality
Recognizing a bimodal distribution can provide several benefits:
Better understanding of data
It reveals that observations may not follow a single simple pattern.
Identification of subgroups
Two peaks may point researchers toward meaningful groups within the dataset.
Better decision-making
Organizations can make more informed decisions when they understand different patterns within their data.
Avoiding misleading averages
Recognizing two clusters prevents researchers from relying blindly on a single mean or median.
Improved statistical analysis
Understanding the shape of the data helps researchers select appropriate analytical methods and models.
17. Limitations and Challenges
Bimodal distributions also present challenges.
Peaks can be difficult to distinguish
If the two groups overlap heavily, the distribution may not show two obvious peaks.
Sample size matters
Small datasets can produce patterns that look like peaks simply because of random variation.
Visualization choices matter
Histogram bin width and smoothing methods can influence how many peaks appear.
Interpretation requires context
A graph alone usually cannot tell you why two peaks exist.
For these reasons, visual evidence should be combined with knowledge about the data and the process that generated it.
18. A Simple Step-by-Step Approach
When you suspect that a dataset may be bimodal, follow these steps:
- Collect and clean the data.
- Plot the data using a histogram or density plot.
- Look for two distinct concentrations.
- Check whether the pattern remains under reasonable visualization choices.
- Examine possible subgroups.
- Compare summary statistics for the groups.
- Investigate possible reasons for the two peaks.
- Use appropriate statistical methods to support the conclusion.
This approach helps distinguish a meaningful bimodal pattern from random fluctuations.
19. Key Takeaways
The most important points about bimodal distributions are:
- A bimodal distribution has two prominent peaks.
- The peaks represent areas where observations are concentrated.
- Bimodality can occur when two different groups or processes contribute to one dataset.
- Histograms and density plots are useful tools for identifying the pattern.
- The two peaks do not need to be equal in size.
- A bimodal distribution is different from a unimodal distribution, which has one main peak.
- Bimodality does not automatically prove the existence of exactly two populations.
- A single mean can sometimes hide important differences between the groups.
- The appearance of bimodality should encourage further investigation and contextual analysis.
Conclusion
A bimodal distribution is more than simply a graph with two hills. It can provide an important clue about the structure of a dataset and may reveal that different groups, processes, or conditions are contributing to the observations.
Understanding bimodality allows students, researchers, and analysts to look beyond simple averages and examine the underlying patterns within data. By using histograms, density plots, subgroup analysis, and appropriate statistical techniques, we can better understand why two peaks appear and what they tell us about the population being studied.
Ultimately, the key lesson is simple: when data show two distinct peaks, do not immediately average them together—investigate what those two peaks represent.

Ehtisham Ahmad, the mind behind techspicies.com, is passionate about technology, innovations and SEO-driven content that empowers readers to stay ahead in the digital world.
Founder & CEO
Ehtisham Ahmad, the mind behind techspicies.com, is passionate about technology, innovations and SEO-driven content that empowers readers to stay ahead in the digital world.